Sensor Testing Plans & Result
Stage 1: Initial Sensor Testing
Sensor Testing Plans:
-
Build simple automation prototype using Lego Mindstorm.
-
Place sensor and breadboard at fixed point on measuring layout sheet.
-
Program for Lego Mindstorm to move forward until 5cm from sensor using EV3 Classroom LEGO MINDSTORM. Repeat with increment to distance between sensor and robot of 5cm until 30cm is reached.
The range of measurement was downscaled from 25m of an actual vehicle to 25cm of a prototype robot. The downscale ratio used 1/100.
Repeat the step at varied measuring angles of 30° to the right, 10° to the right, 30° to the left and 10° to the left. For 2-hour test, the Lego Mindstorm is programmed to continuously move 5 distances at 5 different angles for 2 hours.
Result:
Angle 0°(center)
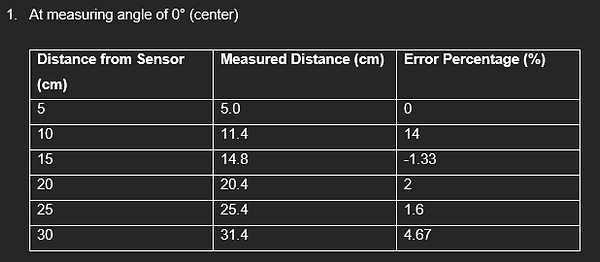

We can see from the data and the graph presented that at the first point 5cm, the distance measured is 5.0cm, and the error percentage is 0%, which is quite accurate. Moving on, at the second point 10 cm from the sensor, the recorded distance is 11.4 cm with a 14% error percentage. At point 15cm from the sensor, the recorded distance is 14.8 cm, with a -1.33% Percentage Error. Meanwhile, at the point distance of 20cm from the sensor, the sensor calculated a measured distance of 20.4cm. As a result, the error percentage is 2%. At point 25cm from sensor, the measured value is 25.4cm, and the computed error percentage is 1.6%. Finally, at point 30 cm from the sensor, the recorded distance is 31.4cm, with a 4.67% error percentage. From all the data, the measured value at 10cm is quite big may be affected by some factor. Other than that the measured value is near to the actual value and the percentage error are small.
Angle 10°to the right from center
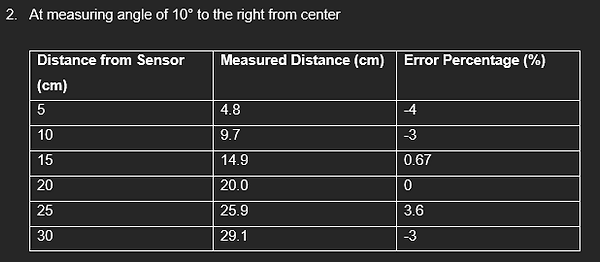

From the data and the graph presented that at the first point 5cm, the distance measured is 4.8cm, and the error percentage is -4%. Moving on, at the second point 10 cm from the sensor, the recorded distance is 9.7 cm with a -3% error percentage. At point 15cm from the sensor, the recorded distance is 14.9 cm, with a 0.67% error percentage. Meanwhile, at the point distance of 20cm from the sensor, the sensor calculated a measured distance of 20cm. As a result, the error percentage is 0%. At point 25cm from the sensor, the measured is 25.9cm, and the computed error percentage is 3.6%. Finally, at point 30 cm from the sensor, the recorded distance is 29.1cm, with a -3% error percentage. From the data, the measured value is near to the actual value and the percentage error are small within the expectation.
Angle 10°to the left from center
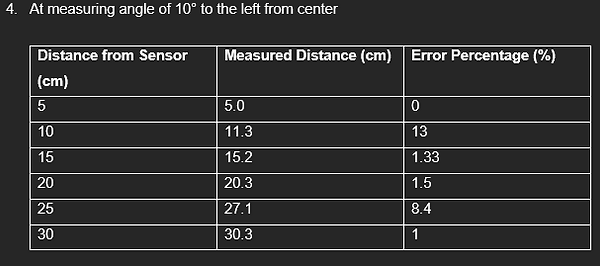

From the data and the graph presented that at the first point 5cm, the distance measured is 5cm, and the error percentage is 0%. Moving on, at the second point 10 cm from the sensor, the recorded distance is 11.3 cm with a 13% error percentage. At point 15cm from the sensor, the recorded distance is 15.2 cm, with a 1.33% error percentage. Meanwhile, at the point distance of 20cm from the sensor, the sensor calculated a measured distance of 20.3cm. As a result, the error percentage is 1.5%. At point 25cm from the sensor, the measured is 27.1cm, and the computed error percentage is 8.4%. Finally, at point 30 cm from the sensor, the recorded distance is 30.3cm, with a 1% error percentage. From all the data, the measured value at 10cm and 25cm is quite big may be affected by some factor. Other than that the measured value is near to the actual value and the percentage error are small within the expectation.
Angle 30°to the right from center
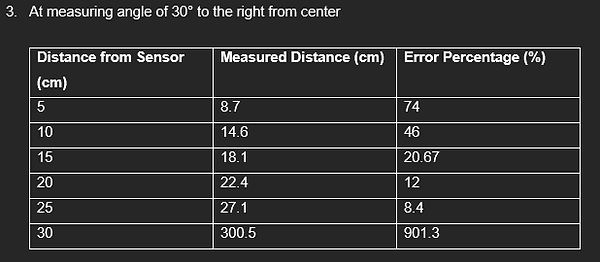
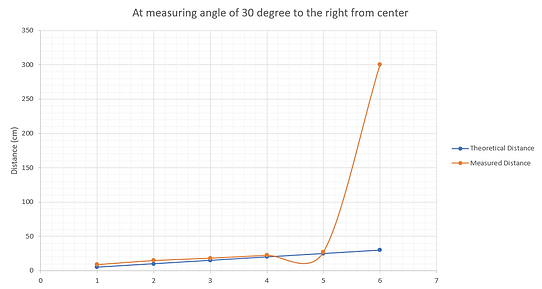
From the data and the graph presented that at the first point 5cm, the distance measured is 8.7cm, and the error percentage is 74%. Moving on, at the second point 10 cm from the sensor, the recorded distance is 14.6 cm with a 46% error percentage. At point 15cm from the sensor, the recorded distance is 18.1 cm, with a 20.67% error rate. Meanwhile, at the point distance of 20cm from the sensor, the sensor calculated a measured distance of 22.4cm. As a result, the error rate is 12%. At point 25cm from the sensor, the measured value is 27.1cm, and the error percentage is 8.7%. Finally, at point 30 cm from the sensor, the recorded distance is 300.5cm, with a 901.3% error percentage. From the data, all the measured values become far from the actual value. The percentage error becomes larger than the percentage error consideration.
Angle 30°to the left from center

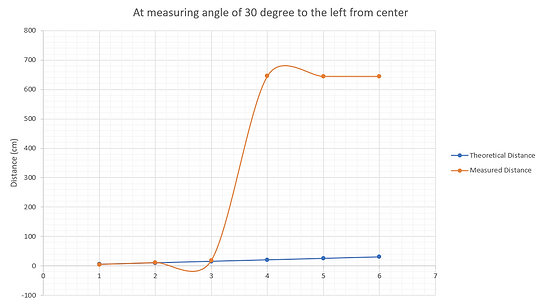
From the data and the graph presented that at the first point 5cm, the distance measured is 4.6cm, and the error percentage is -8%. Moving on, at the second point 10 cm from the sensor, the recorded distance is 10.9 cm with a 9% error percentage. At point 15cm from the sensor, the recorded distance is 18.9 cm, with a 0.26% error rate. Meanwhile, at the point distance of 20cm from the sensor, the sensor calculated a measured distance of 645.1cm. As a result, the error rate is 3125.5%. At point 25cm from the sensor, the measured is 644.4cm, and the computed error percentage is 2477.6%. Finally, at point 30 cm from the sensor, the recorded distance is 644.3cm, with a 2047.67% error percentage. From all the data, at the first tree point measurement, the measured value is near to the actual value and the percentage error are small within the expectation. But, when the measurement from 20cm to 30cm, the measure starting not accurate and and the percentage error become very big.
Stage 2: Implementation of External componen
2 HOURS TEST
VIDEO:
RESULT:
First iteration
Second iteration


Graph:


Observation 1:
Based on the data collected, most of the distances detected by the sensor stayed within a range of 11mm to 3271mm, and average around 914mm for the entire first hour of the testing and 1184mm for the entire second hour of the testing.
Analysis:
An average distance of 914mm was achieved in the first hour and 1184mm in the second because the Lego Mindstorm prototype was programmed to move within to the measuring mat. The measuring mat was made of Mahjong paper and has a dimension of 863.4mm x 863.4mm. The measuring mat is displayed below:
Diagram 1 Measuring Mat
It was used to ensure that the prototype was moving within the detection range of the ultrasonic sensor which is 20mm-4000mm. Hence, the average distance recorded by the sensor is 914mm and 1184mm. However, when the prototype travels outside of the measuring mat, the distance can still be recorded given that it is within the ranging distance. Therefore, distances that are higher than the average distance is recorded. One example of this occurrence can be seen at 0:35:36 where the distance recorded was 3271mm. This indicates that at 0:35:36, the prototype vehicle moved outside of the measuring mat but still within the measuring range
Observation 2:
The distance spikes to a value between 11680mm and 11665mm at 76 points in the first hour of the 2-hour testing and at 78 points in the second hour of the 2-hour testing.
Analysis:
The spike of distances occurs as a response to when the distance is outside of the ranging distance and is undetectable by the sensor. This can happen due to a few reasons:
1.Prototype is too close to the sensor: the minimum distance measurable by the sensor is 20mm. Therefore, when the prototype moves to a distance lesser than 20mm from the sensor, the value will be undetectable and a spike in value will happen. This may also occur when the prototype crashes into the sensor.
2. Prototype is too far from the sensor: the maximum distance measurable by the sensor is 4000mm. Therefore, when the prototype moves to a distance larger than 4000mm from the sensor, the value will be undetectable and a spike in value will happen.
3.Prototype is at an angle outside of measuring angle: the sensor has a measuring angle of 30° with an effectual angle of 15°. Hence, when the prototype moves to a distance that exceeds the measuring angle, the value will not be detected and a spike in value will happen.
Stage 3: Application
The sensor Ultrasonic HC-SR04 was put on the prototype car LEGO Mindstorm EV3 as the application.

